Original Reality Theory
Aa
2 Before Explaining the Theory / 2.4 Calibrating How We See: Perspective and Context
2.4.1 Calibrating Perspective
Is it possible to observe the same phenomenon, use correct scientific information, and reach apparently contradictory conclusions? Under certain circumstances, yes. Not because science has changed its mind during the reading, but because we have changed the question, the unit of measurement, the time interval, or the scale being considered.
Before you continue, I propose an exercise. You will not need to believe any hypothesis of Original Reality Theory or know its concepts. We will work with findings produced by science itself. The purpose is to notice how seemingly obvious answers can depend on criteria we do not always state.
In each comparison, try to answer the first question before reading the answer. Then notice what happens when we change the frame of reference. The phenomenon does not have to change for the conclusion to change.
The Sun and the brain: which is more powerful?
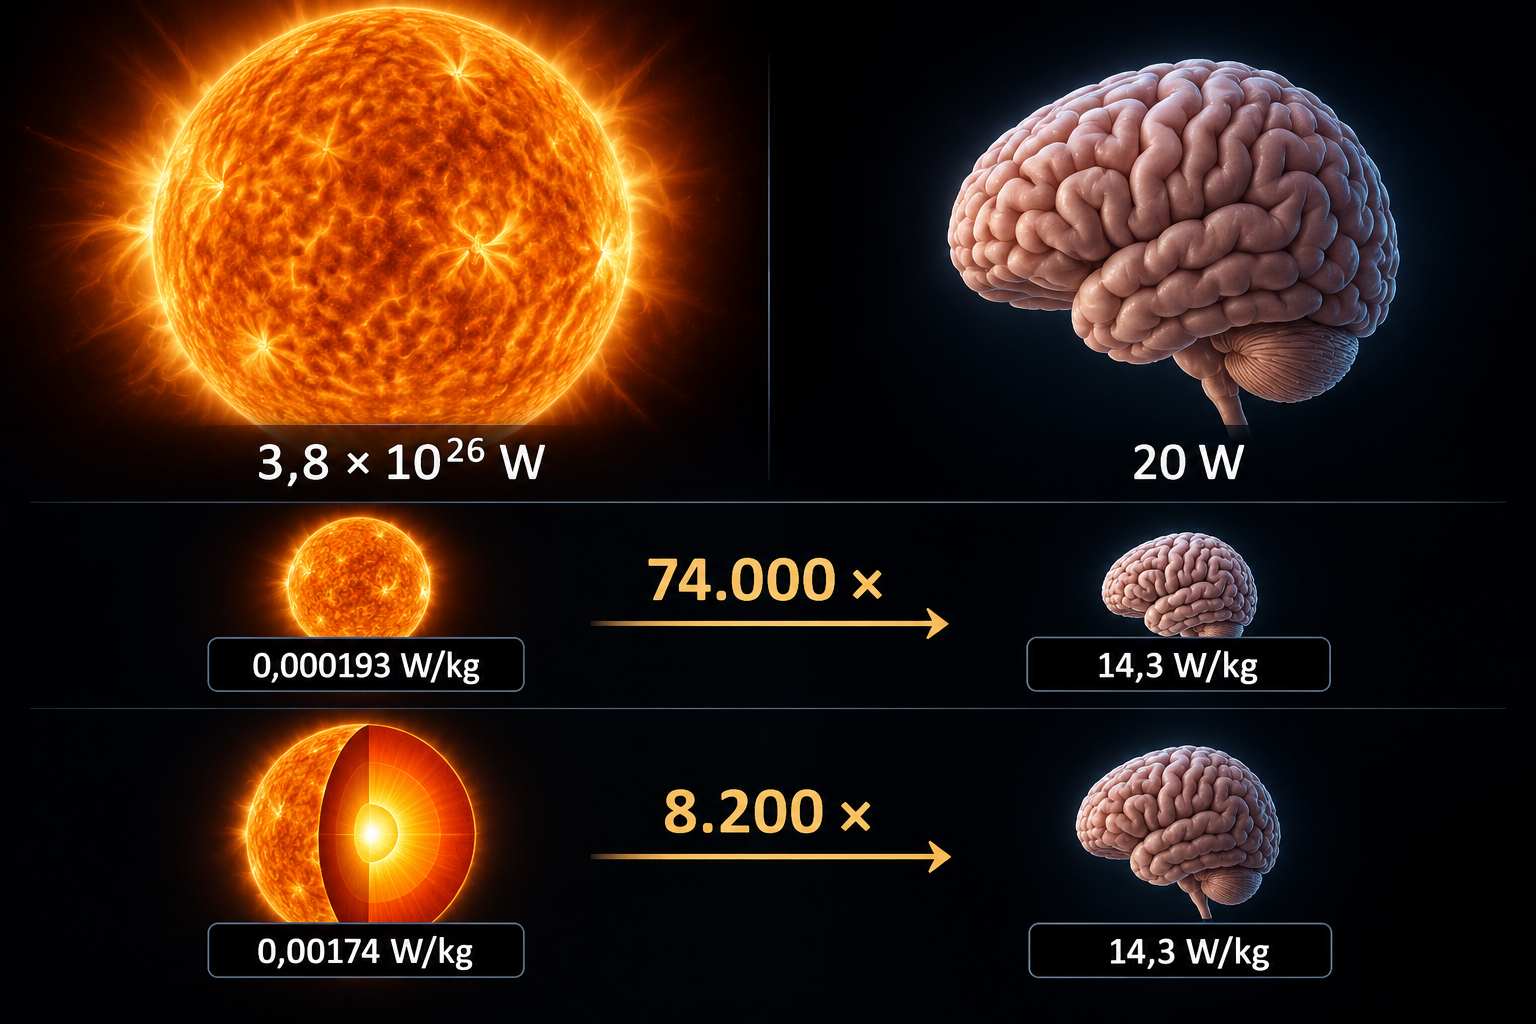
Imagine the Sun on one side and a human brain on the other. Which is more powerful? If we compare total power, the answer is the Sun, by such an enormous margin that the comparison almost seems like a joke. Its luminosity is on the order of 3.8 × 10²⁶ watts. An adult human brain uses approximately 20 watts of metabolic power. In both cases, we are measuring energy per unit of time: the energy radiated by the Sun and the energy consumed by the functioning brain. One watt equals one joule per second.
Now let us ask a different question. Instead of comparing the two complete systems, how much power corresponds to each kilogram of matter? A brain weighing approximately 1.4 kilograms uses about 14.3 watts per kilogram. The Sun’s luminosity divided by its total mass, meanwhile, corresponds to approximately 0.000193 watts per kilogram.
The result is surprising: in this comparison by mass, the brain’s metabolic rate is approximately 74,000 times greater than the Sun’s average power per kilogram. The brain has not become more powerful than the entire Sun. We have simply stopped comparing totals and started comparing averages normalized by mass.
What if we consider a small region near the center of the Sun, where energy production per kilogram is higher? The gap narrows, but it remains striking: the brain still shows approximately 8,200 times more power per kilogram.
Two answers—“the Sun” and “the brain”—can therefore both be correct, provided they answer different questions. The first concerns total power. The second concerns average power per unit of mass. If we leave out that distinction, we create a dispute between numbers that were never measuring the same thing.
Can lightning be hotter than the Sun?
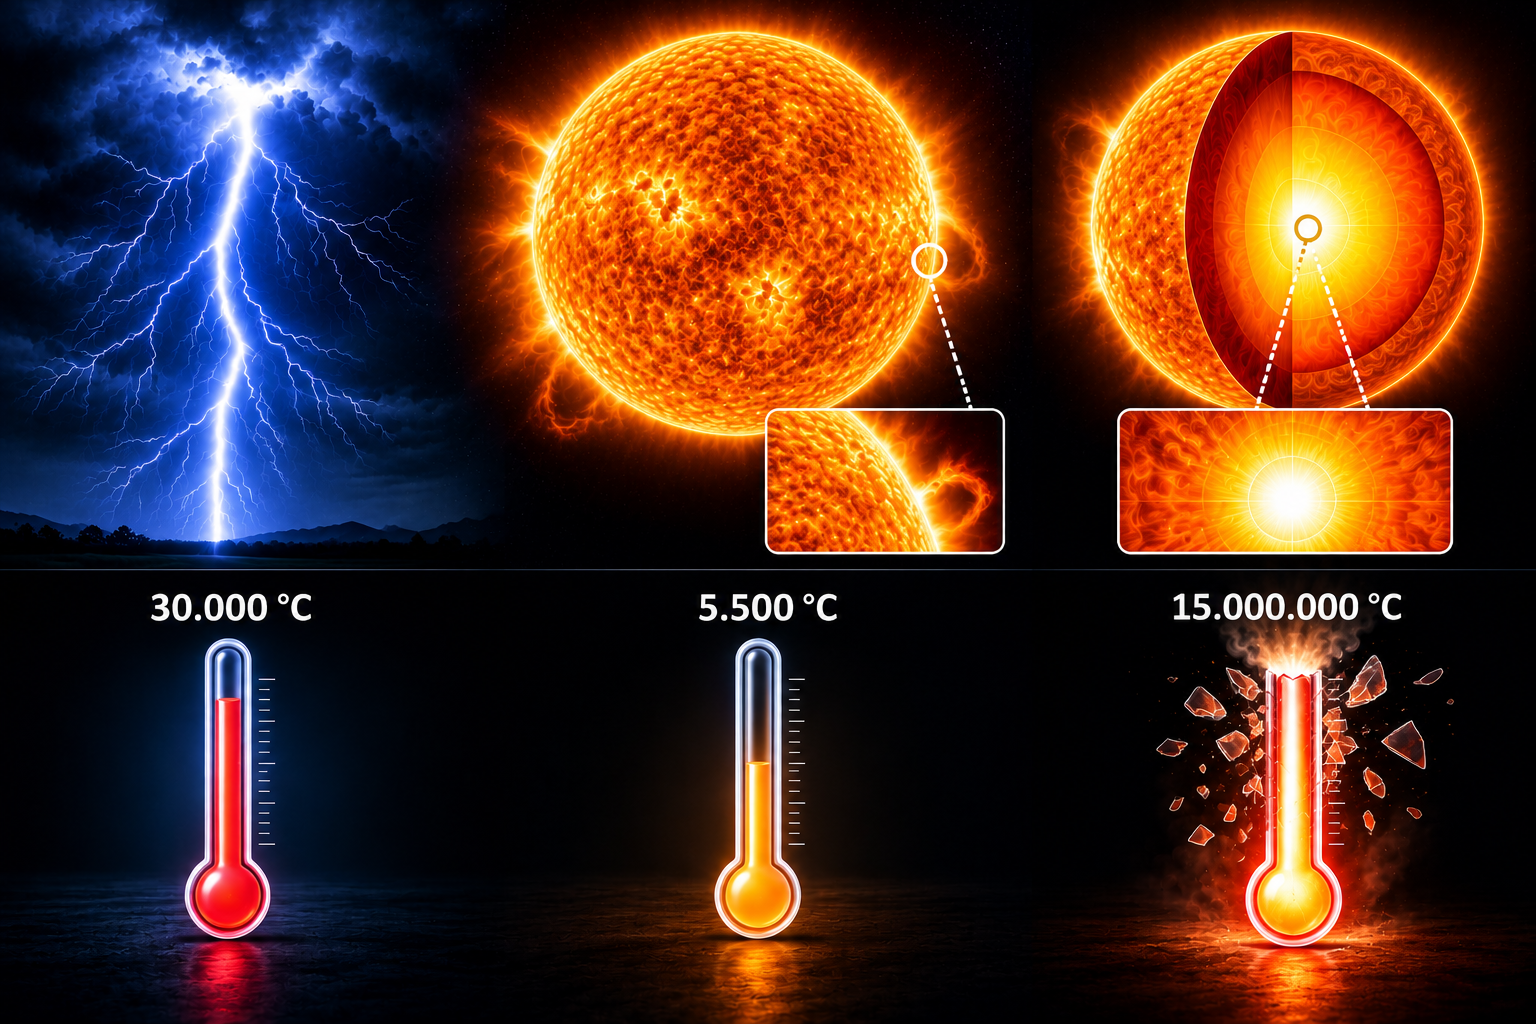
Without looking at the answer, which seems hotter: the Sun or a lightning bolt? Intuition usually favors the star. Yet the air heated along the channel of an electrical discharge can reach temperatures on the order of 30,000 degrees Celsius, while the photosphere—the region we usually call the Sun’s surface—is approximately 5,500 degrees Celsius.
So is lightning hotter than the Sun? That depends on which part of the Sun we are considering. Its core reaches about 15 million degrees Celsius. The comparison changes completely when we shift our focus from the photosphere to the star’s interior.
The time conditions also change: the extreme heating of the air in a lightning bolt is brief, whereas the Sun sustains energetic processes over vastly longer timescales. Temperature, total energy, and duration are different properties. One cannot automatically stand in for the others.
A hydrogen bomb and one second of the Sun
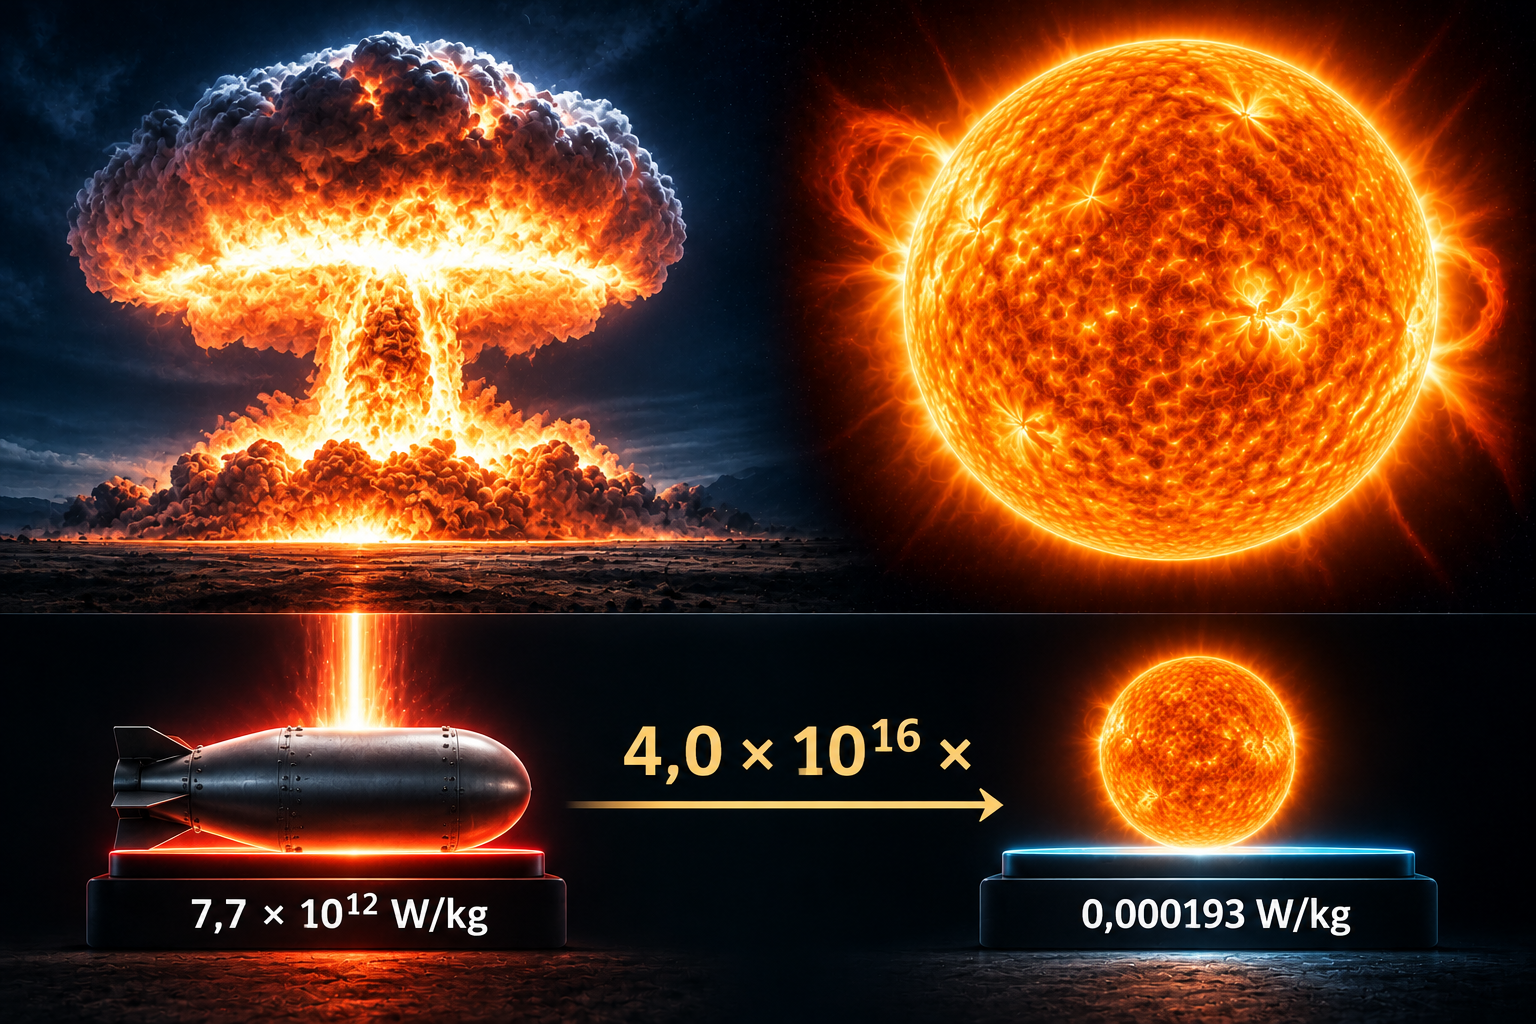
Now think of the Tsar Bomba, the largest nuclear explosion ever detonated. The bomb weighed about 27 metric tons and released energy equivalent to 50 million metric tons of TNT. Compared with the entire Sun, that explosion seems small. But what happens if, once again, we compare energy per kilogram?
To use the same time window, imagine spreading the bomb’s energy over one second. In that calculation, each kilogram of the device would correspond to about 7.7 trillion watts. Each kilogram of the Sun, using its overall average, corresponds to approximately 0.000193 watts.
The result is even more surprising than the brain comparison: in this one-second comparison, the bomb shows approximately 40 quadrillion times more power per kilogram than the Sun’s average.
The Sun still releases far more energy in total. The difference is that the bomb concentrates its release in a very brief explosion; it does not sustain that power for one second. Our one-second window serves only to make a proportional comparison. Once again, changing the question—from the total to the amount per kilogram—completely transforms the result.
Inside the human body and at the heart of a star
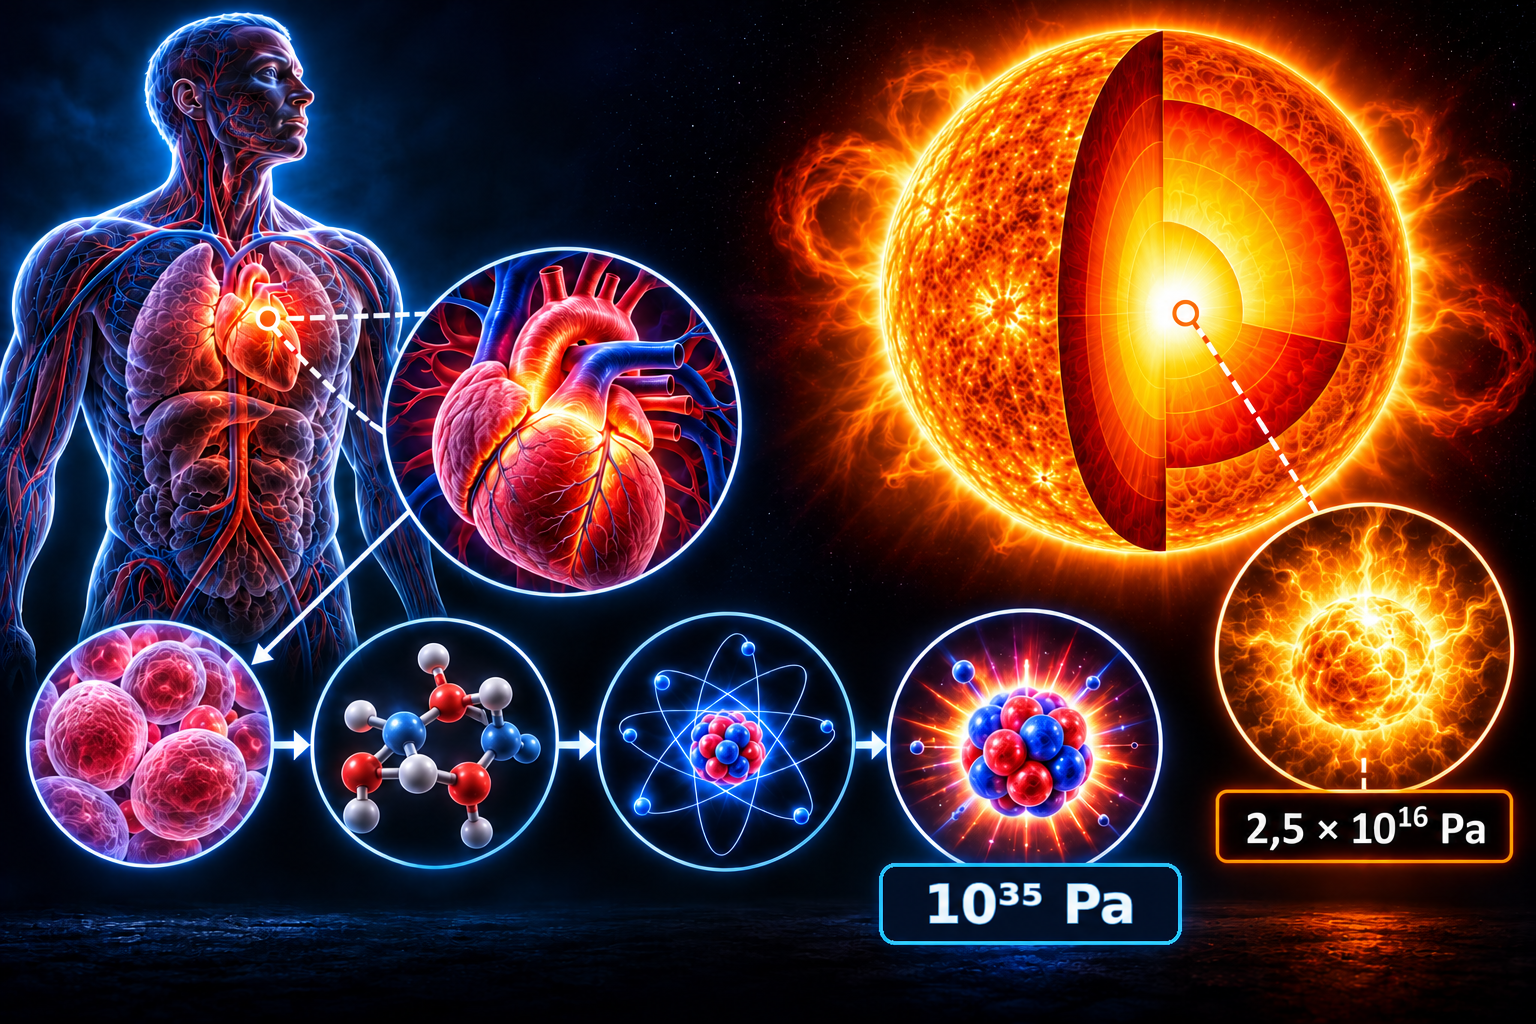
Think about your own body. It is made of cells, which contain molecules composed of atoms. And in the nuclei of those atoms, we find protons. Now imagine the pressure at the center of the Sun: approximately 2.5 × 10¹⁶ pascals. It seems hard to find anything more extreme. But let us leave the star for a moment and return to one of those particles we carry within us. In 2018, researchers estimated a pressure of approximately 10³⁵ pascals near the center of a proton.
That is about 4 quintillion times the pressure at the Sun’s center. Yes: a small region inside a single proton in our bodies has a pressure vastly greater than that found at the heart of the star. And the Sun itself is also made of atoms.
How can such an enormous intensity exist in something so small? The investigation revealed a distribution of pressures: near the proton’s center, there is an outward contribution; in more external regions, confining forces act inward. This organization contributes to the particle’s stability. Its enormous internal pressure therefore does not become a pressure of the same magnitude on our tissues.
In the previous examples, we compared power per kilogram. Here we are measuring a different quantity: pressure, expressed as force per unit area. But the contrast teaches a similar lesson: an object’s size does not, by itself, determine the intensity of the phenomena we find inside it. Think of a neutron star: the extremely compact remnant of a star, one of the most extreme environments known in the universe. Yet at this very moment, the protons that make up our own bodies contain internal pressures greater than those at the Sun’s center, which can even exceed values estimated inside a neutron star. The extraordinary is not only out there—it is also within us.
A cell and a star: what are we calling complex?
The Sun and a single cell are made of matter subject to the same physical laws. But look at how that matter is organized. In the Sun, extreme temperatures keep much of it in the form of plasma, with atomic nuclei and free electrons. The fusion of hydrogen into helium releases energy; radiation, plasma movements, and magnetic fields participate in the star’s dynamics.
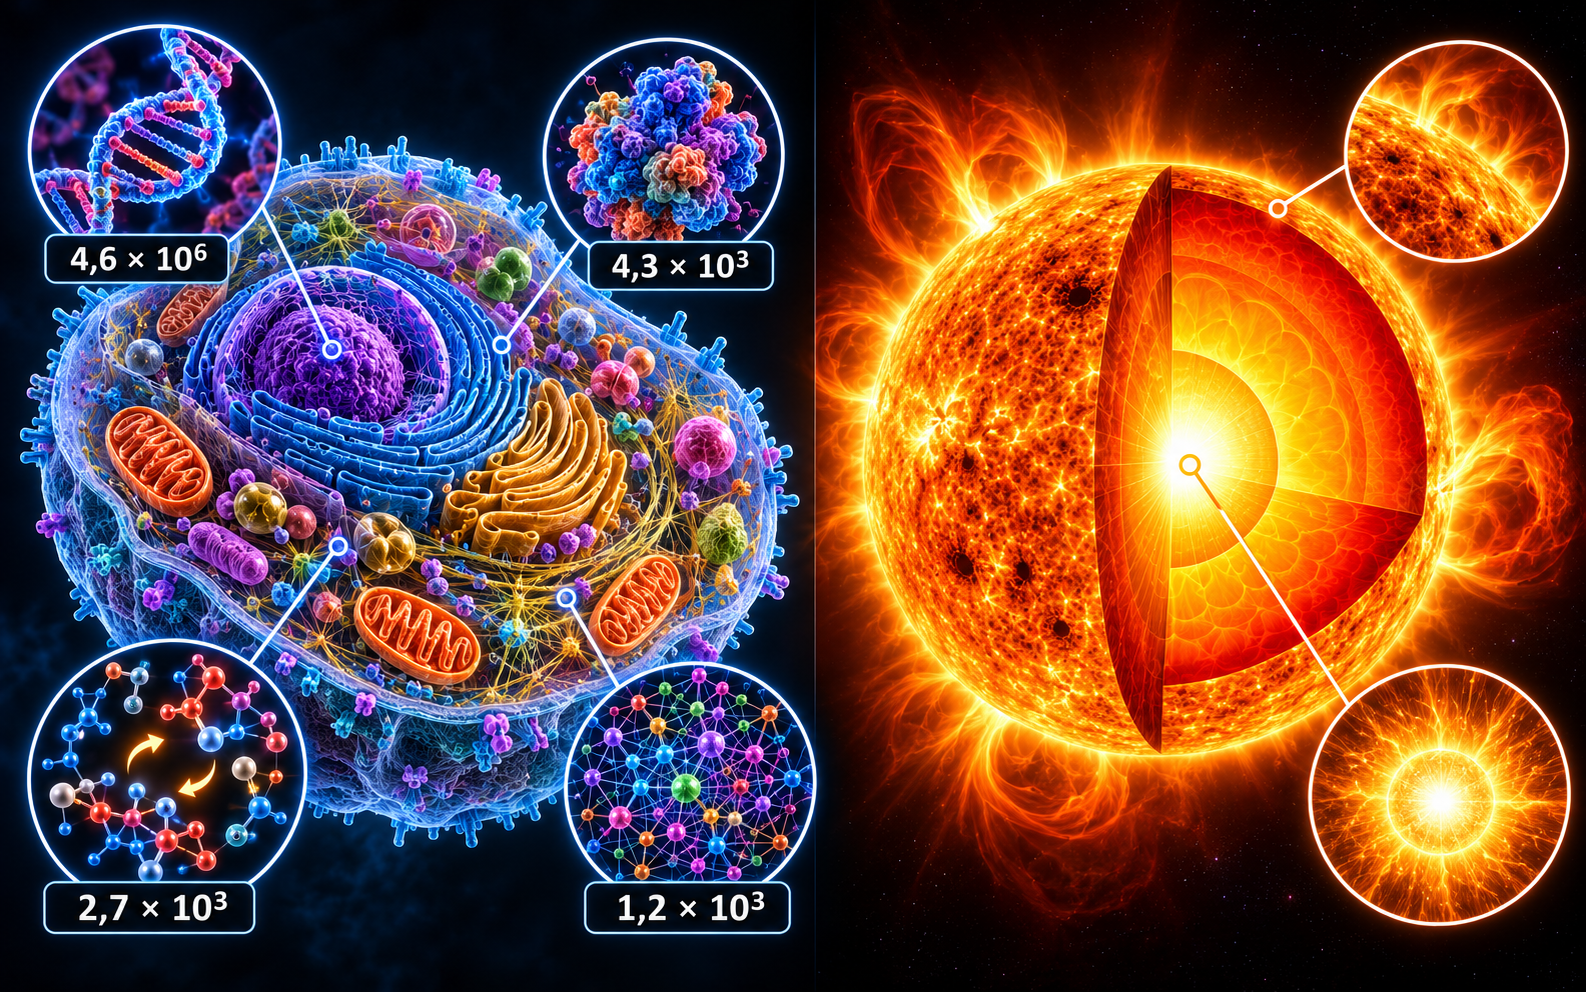
Now reduce the scale to an E. coli bacterium: a single cell. Its DNA contains approximately 4.6 million base pairs and instructions for producing about 4,300 types of proteins. Researchers have built a model of its metabolism that includes about 2,700 chemical reactions and 1,200 different substances. These are not numbers for an entire organism. They all describe aspects of how just one cell functions.
This is where the contrast appears. In the Sun, matter participates in nuclear processes and collective plasma movements. In the cell, atoms form thousands of molecules with specific structures and functions: some accelerate reactions, others transport substances, and still others make it possible to read DNA information, build components, and repair damage. These activities are not independent; they must work in coordination for the cell to remain alive.
Therefore, if we compare the diversity of specialized molecular arrangements and the integration of regulated chemical functions, a single cell exhibits far greater functional complexity than we find in the Sun in that respect. Not because biology lies outside physics: it is matter itself, obeying the same laws, organized in radically different ways. An enormous star impresses us with its energy; a microscopic cell, with the thousands of relationships it can keep functioning at once. Size alone does not reveal the complexity of the arrangement.
The entire theory on a single pageContinuous reading for people and AI tools.